Career box, trend line and seasons
See in two seconds where a horse is in its career
Three small panels sit above each horse's runs. Together they tell you in two seconds where the horse is in its career.
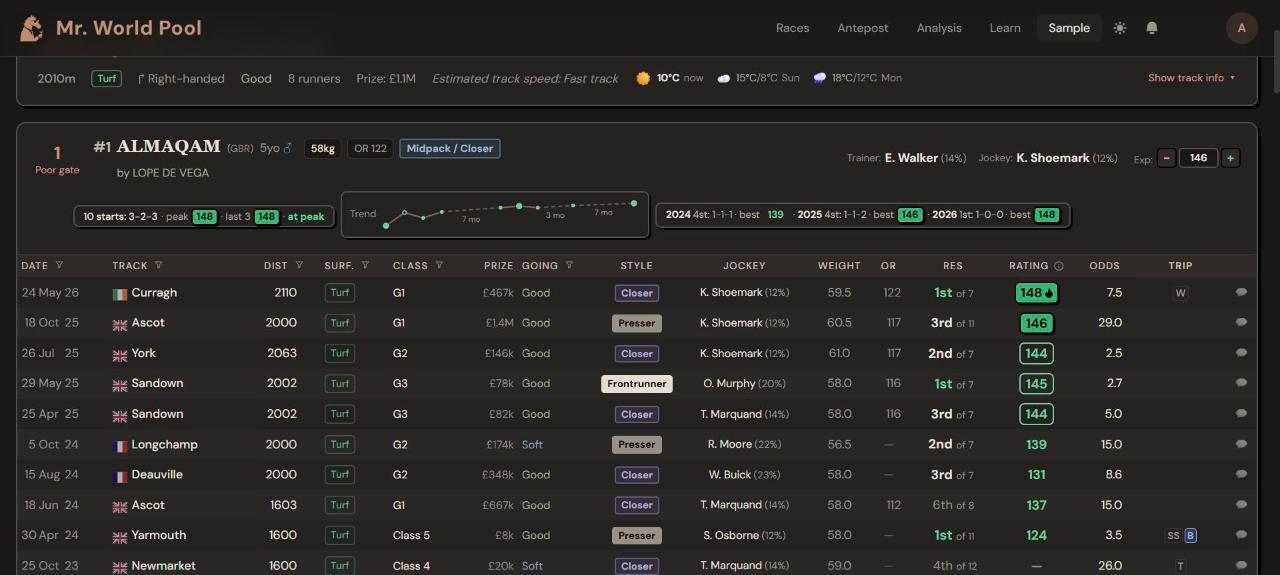
The career box (left)
10 starts: 3-2-3 · peak 148 · last 3 148 · at peak
- Starts and wins-seconds-thirds.
- Peak: the best level the horse has run to.
- Last 3: its best rating in the last three runs.
- At peak / near peak / below peak: how the two compare.
Hover the box for a short explanation. In Expert view the hover opens the full career breakdown: the record by surface, distance, direction, going and track speed, with today's conditions in bold.
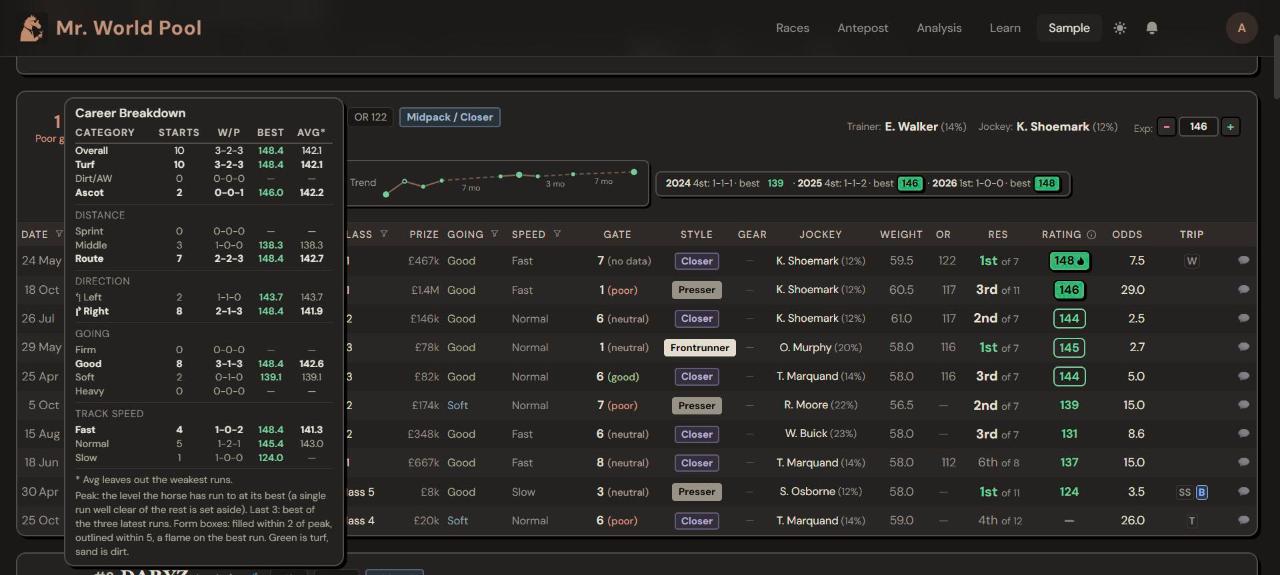
The trend line (middle)
Each dot is one run, oldest on the left. The higher the dot, the better the run.
- Rising: improving.
- Flat and high: reliable.
- Falling: getting worse.
- Up and down: hard to trust.
The small labels (7 mo, 3 mo) mark breaks between runs. Hover a dot to see that race: track, date, result, going and the rating.
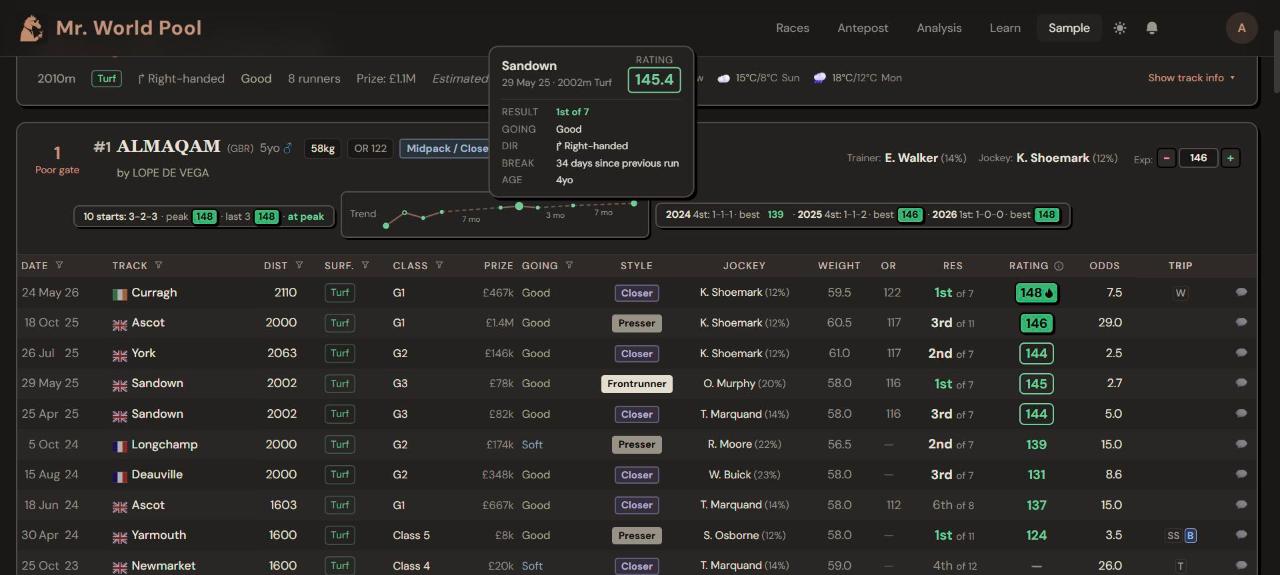
The season box (right)
One entry per year: starts, record and the best rating that season. A quick way to see whether the horse is better or worse than last year.
What should I ask myself?
Is the horse at its best right now, coming back to it, or past it? The trend line usually answers before you have read a single row.
See it on the card: open any racecard and press 📖 Tour at the top right. The tour points at each of these things in turn. Start the tour on the free sample card.
Want the thinking behind it? That is what the course is for. The Intro track is free; the full course is coming soon.