Trainer, jockey and sire: Win %, Edge and Conf
Read a stats box and know how much to trust it
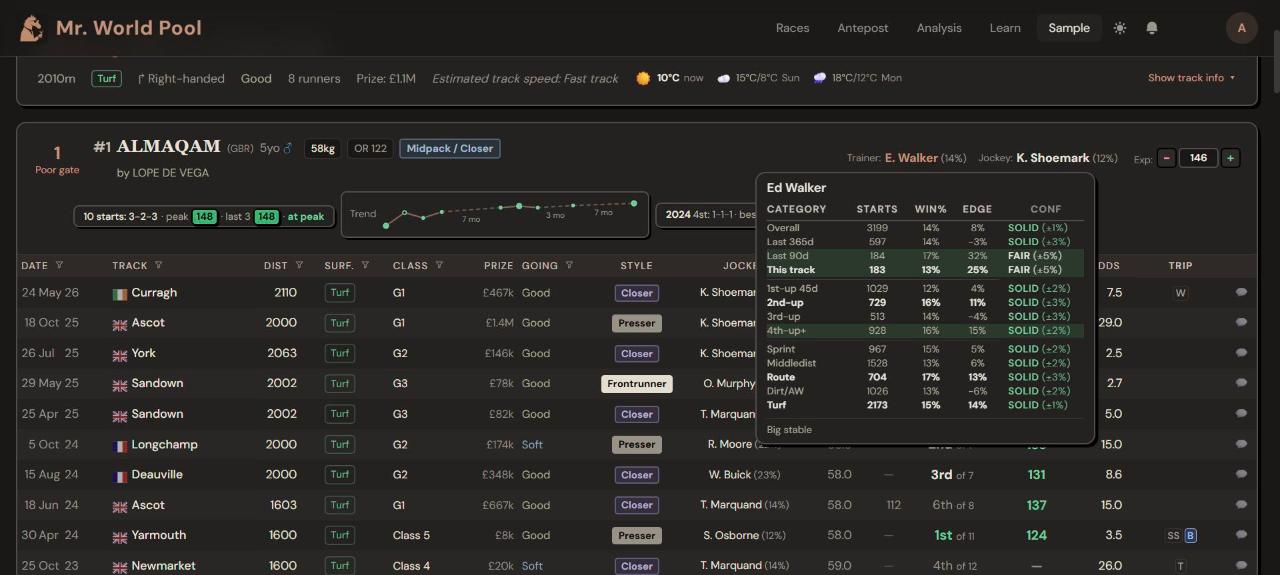
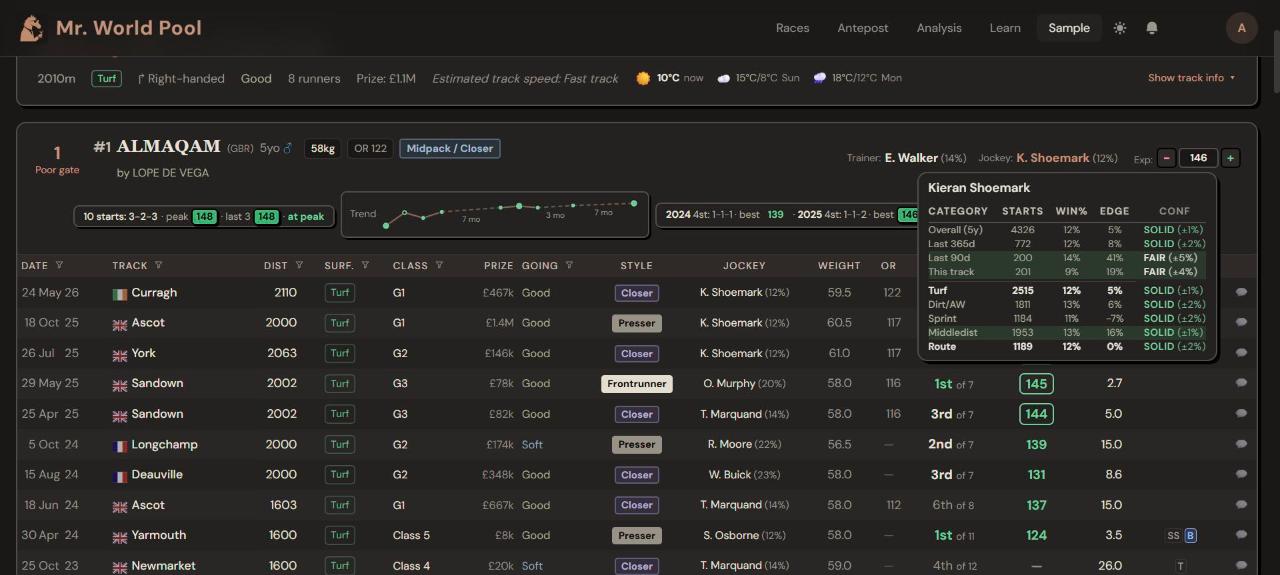
Hover a trainer, a jockey or a sire on the card and a statistics box opens.
How do I read the box?
Each row is one situation: overall, the last 365 or 90 days, this track, first run after a break (1st-up), second run (2nd-up) and so on, then sprint, middle distance, route, turf, dirt. Rows that match today's race are in bold.
| Column | Meaning |
|---|---|
| Starts | How many runs the row is built on |
| Win % | How often they won |
| Edge | How much more or less often they won than the betting market expected |
| Conf | How much to trust the row |
What is Edge?
Win % on its own can fool you. A trainer with many favourites wins a lot without being clever. Edge asks a better question: did they win more often than the odds said they should?
- 0 %: exactly as often as the market expected.
- +12 %: twelve per cent more often.
- −15 %: fifteen per cent less often.
A strong positive Edge tints the row green.
How Edge is worked out (for the curious)
- For every runner in a race we turn the starting price into a chance of winning: 1 divided by the odds.
- Those chances add up to more than 100 % because of the bookmaker's margin, so we scale them down until the race adds up to exactly 100 %.
- Over all the trainer's runners in the row, we add up the chances. That is how many winners the market expected.
- Edge = (actual winners − expected winners) ÷ expected winners.
Taking the margin out is what makes 0 % mean "the same as the market" and not "beat the bookmaker's cut". It also means one winner at 100/1 cannot make an ordinary record look good, which is the problem with plain profit and loss.
</details>
Why is there a Conf column?
Because a big number on few runs means nothing. Conf tells you how solid the Win % is, with the margin of error beside it:
| Conf | Read it as |
|---|---|
| SOLID (±3 or less) | Reliable. You can lean on it |
| FAIR (±4 to 6) | About right, not exact |
| WEAK (±7 to 10) | The direction may be right, the size is unknown |
| NOISE (more than ±10) | Too few starts. Ignore the number |
How Conf is worked out (for the curious)
It is a standard statistical margin of error (a 95 % Wilson interval) on the win rate, in percentage points. A trainer with 14 % winners and "±1" is very likely between 13 % and 15 % in the long run. One with 25 % and "±12" could be anywhere from 13 % to 37 %. More starts make the margin smaller.
</details>
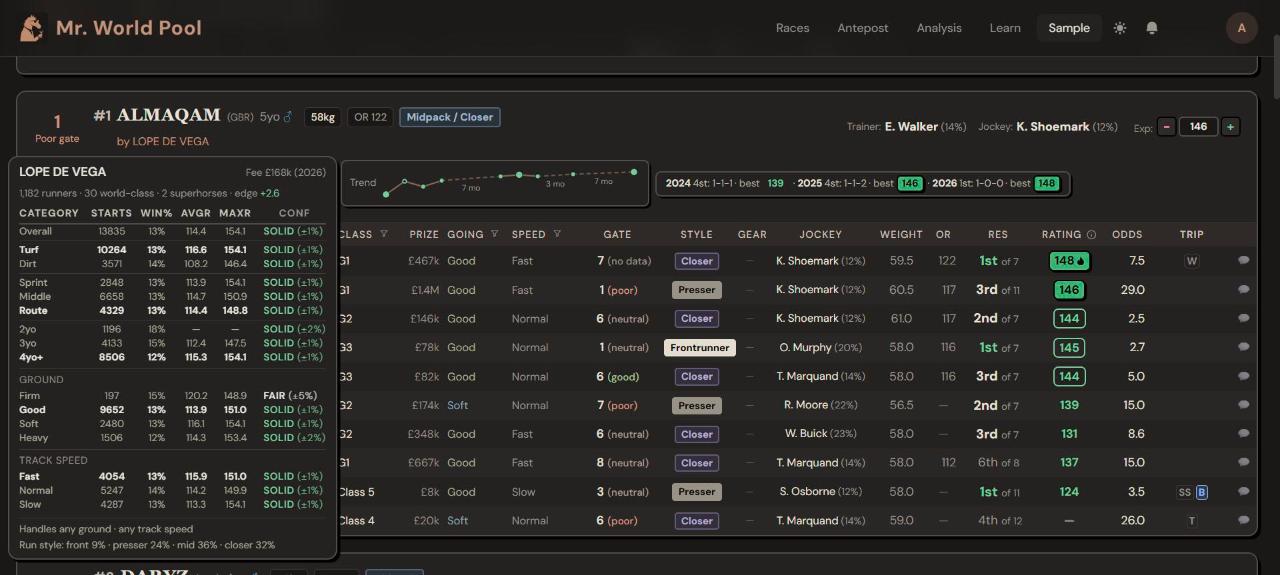
What about the sire?
Hover the sire's name for how the father's offspring do by surface, distance, age and ground. It is most useful for horses with few runs of their own. The full sire profile shows in Expert view, with the average and best rating of the offspring in each situation:
What do people get wrong?
They see "+40 % Edge" and stop reading. Look at Starts and Conf first.
See it on the card: open any racecard and press 📖 Tour at the top right. The tour points at each of these things in turn. Start the tour on the free sample card.
Want the thinking behind it? That is what the course is for. The Intro track is free; the full course is coming soon.