Are You As Sharp As You Think? Calibration for Bettors
When you say a horse is a 30% chance, does it actually win 30% of the time? Calibration is the test of whether your probabilities mean what they say, and most bettors fail it.
Every value bet rests on a probability you assigned. You looked at a race, decided a horse was a 30% chance, compared it to the price, and bet. But here is the question almost nobody asks: when you say "30%", does the thing actually happen 30% of the time? If not, every value calculation you make is arithmetic performed on fiction. The arithmetic will be flawless. The fiction will be expensive.
That property, whether your stated probabilities match reality, is called calibration, and it is the most neglected skill in betting.
What Calibration Means
You are well calibrated if, across all the times you say "30%", the outcome happens about 30% of the time; across all your "70%" calls, about 70%. It is not the same as knowledge. You can know a sport inside out and still be badly calibrated, because deep knowledge tends to produce more confidence, not more accuracy.
The Tilt Is Nearly Always Overconfidence
Run the exercise on a few hundred bets and most people discover their 30% horses win more like 22%, their 20% shots more like 14%. They're overconfident: they back their own reads harder than the results justify. Their 70%-confidence picks win around 60% of the time; their 80% picks nearer 70%. The gap is quiet and constant, and it turns bets that feel like value into bets that aren't.
It's not a character flaw; it looks like a default human setting, and it seems to get worse after a winning streak — the usual story is that you trust your estimates more, raise stakes, and start taking marginal bets you'd normally pass. Overconfidence is expensive precisely because it's invisible from the inside. You feel exactly as sharp whether your probabilities are sound or inflated. The only way to catch it is to measure it.
Why It Costs You Money
Value betting depends entirely on the probability you feed it. If you believe a horse is a 30% chance and take a price that's only fair at 25%, you've found value, if your 30% is real. If you're overconfident and the true number is 24%, you haven't found value at all; you've found a losing bet that feels like a winner. Overconfidence doesn't announce itself. It feels exactly like insight.
How to Measure Your Calibration
It's mechanical, and it requires just one habit you should already have: writing down your estimated probability before every bet (see how to track your bets).
- Record your pre-bet probability on every bet.
- After a few hundred bets, bucket them by stated probability: all your 50–55% calls, all your 55–60% calls, and so on.
- Compute the actual win rate in each bucket.
- Plot actual against stated, next to the 45-degree "perfect calibration" line.
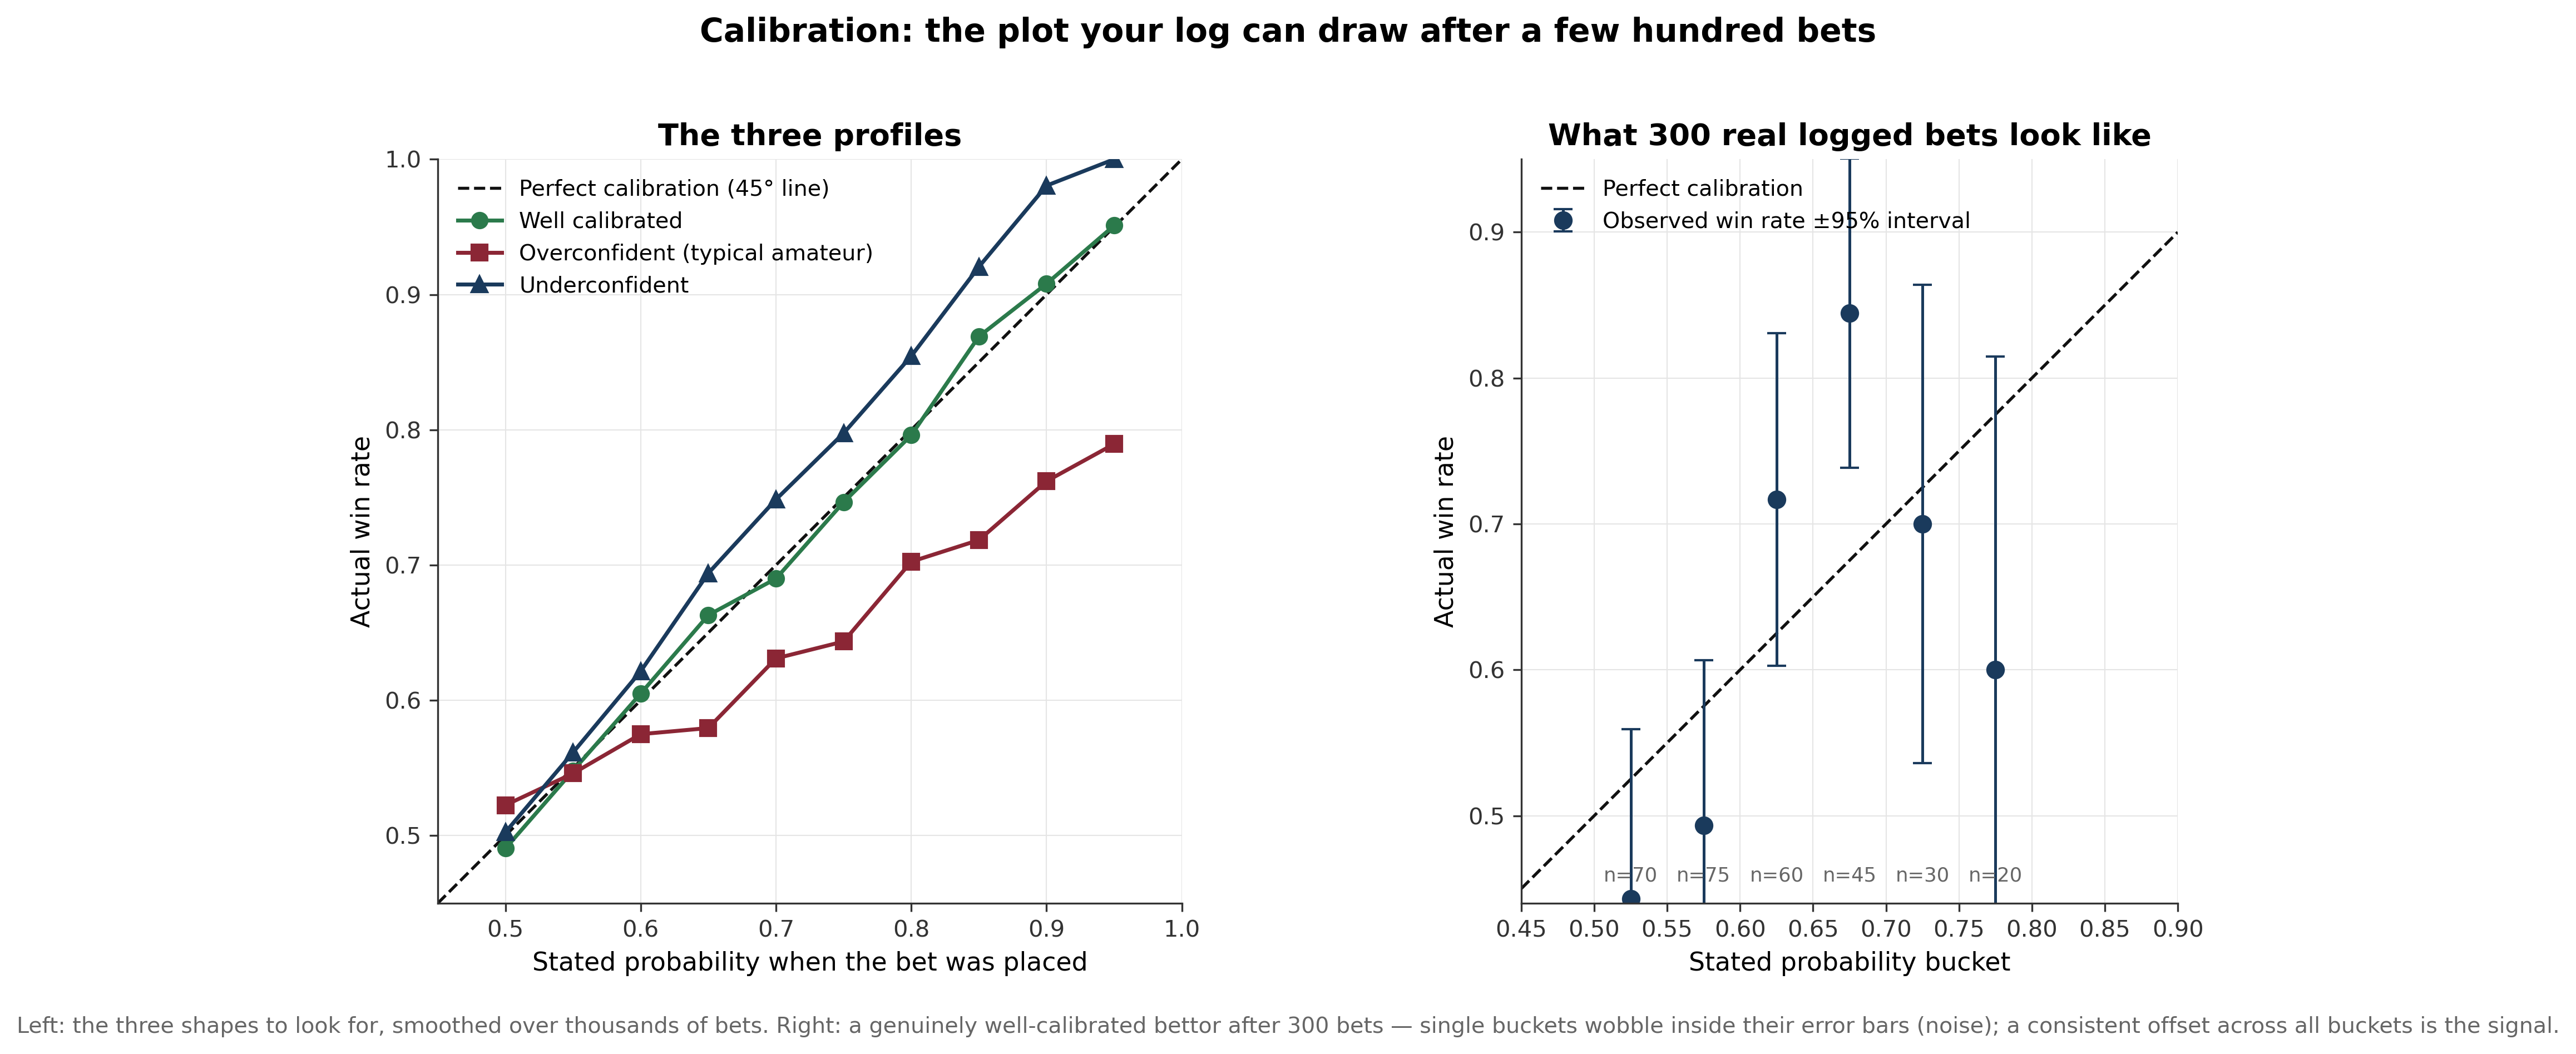
Read the shape. Points sitting below the line mean overconfident: your stated 70% is really 60%. Points above mean underconfident, which is rarer and cheaper. Points on the line mean your numbers mean what they say.
Two reading rules. Small buckets are noisy: twenty bets at "75%" tells you little on its own, and you shouldn't react to a single wobbly point. The signal is the pattern: if your whole curve sits below the diagonal, that's a real, fixable problem. And it's a sample-size game. You need a few hundred bets before the picture is trustworthy, which means there's no feel-based shortcut. You either have the record, grouped by your stated probability, or you're guessing about your own accuracy.
How to Fix It
The fix for overconfidence is blunt and it works: shade your estimates toward the middle. If you're about to say 70%, make it 65%. About to say 80%, make it 73%. Do this for a few hundred bets, re-plot, and watch the curve move toward the diagonal. Most people who do this become meaningfully better calibrated within a season. Almost nobody who skips the plot ever improves, because they never see the problem. It's measurable and improvable, but only with deliberate practice and real feedback, not by simply intending to be less sure.
Calibration and CLV Are a Pair
This is why calibration and closing line value work together. CLV tells you whether you're beating the market's price; calibration tells you whether your underlying probabilities are sound. Together they answer the two questions that matter: are my numbers right, and are they better than the market's?
And the payoff is a hidden edge. The same form-reading skill, the same ratings, the same race knowledge, but now your probabilities are sound, so your value judgments are real instead of inflated. You stop taking "value" that was only overconfidence in disguise, and you start trusting the genuine overlays you'd have second-guessed. A bettor who knows they run 8% overconfident and adjusts for it is more dangerous than one who's naturally sharper but flying blind.
The trouble is that drawing the plot by hand, bucketing hundreds of bets, computing rates, adding error bars, is exactly the chore that never happens. That's why we built calibration straight into the tracker.
See your own calibration curve. The MWP bet tracker turns your logged probabilities into a calibration plot automatically — log your pre-bet number and the curve draws itself, so you can finally see whether "70%" means 70%. See the bet tracker, and start with how to track your bets.
Related: Closing line value explained · Value betting in horse racing