How Horse Racing Form Differs by Country
A form line is not a fixed quantity — it means different things depending on the country it came from, because every jurisdiction runs a different programme over different ground.
A "good closing run" in France and a "good closing run" in Ireland are not the same fact. The first is a horse doing what its programme rewards; the second is a horse doing something the ground usually punishes. Same form line, opposite meaning — and the only difference is the country the horse learned the game in.
This is the part of international handicapping that trips people up. The craft of reading form is universal: rate the horse, read the pace, weigh the class. But the base rates you read it against are local. The programme shape, the surface bias, the reliability of the favourite — all of it shifts across borders. Before you trust a form line, you have to know which classroom produced it.
The Programme Shape Differs First
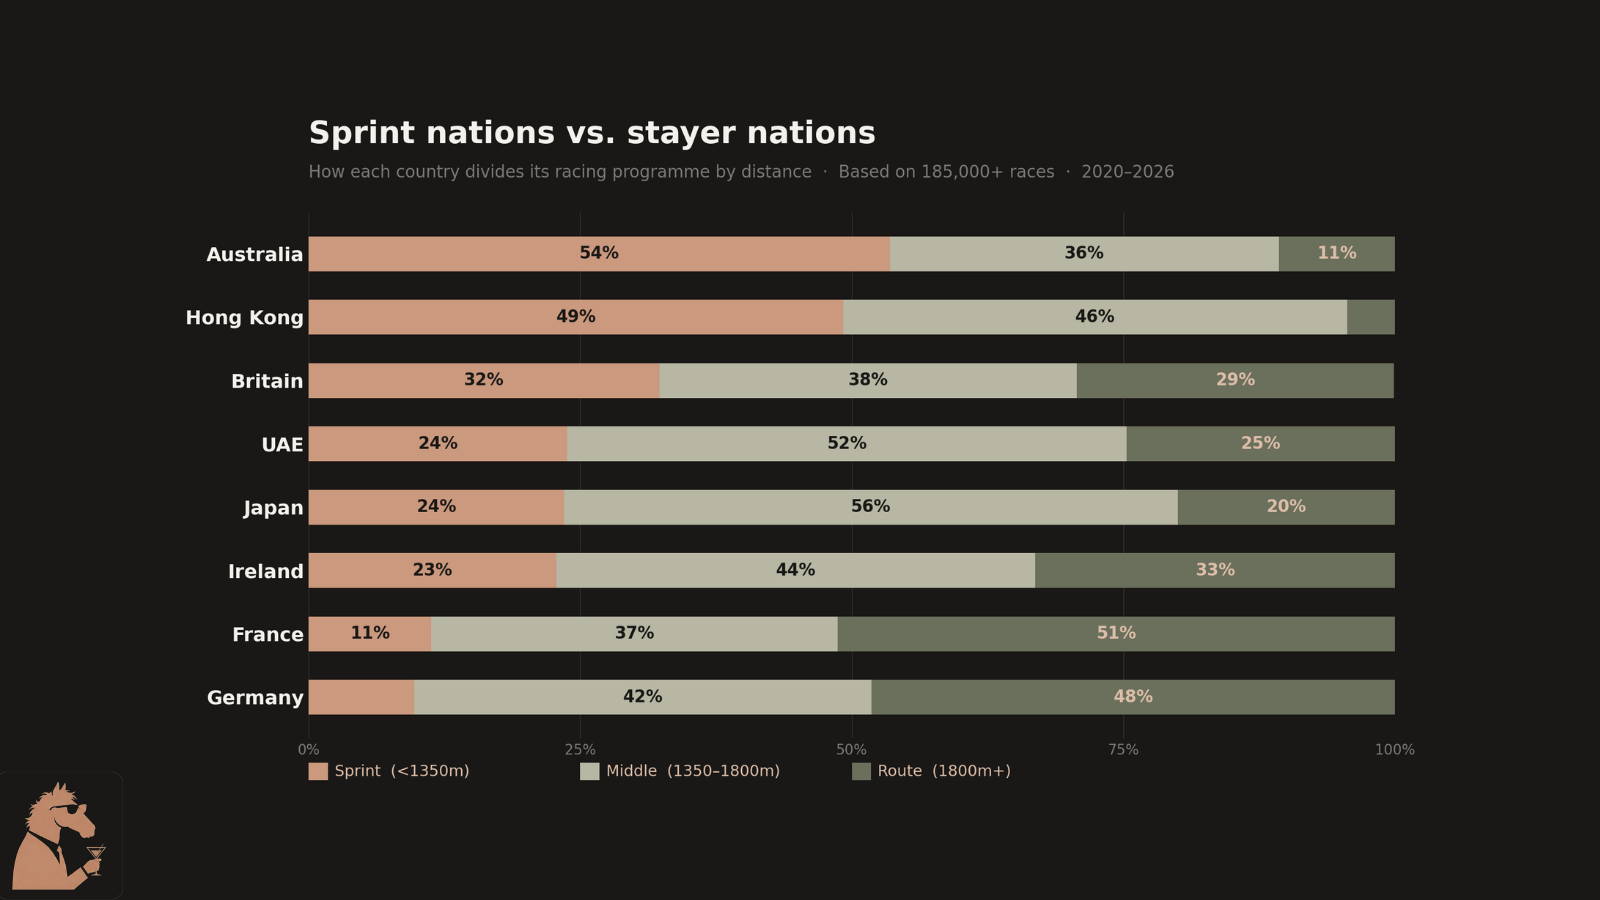
The biggest difference is the simplest one: countries write completely different cards. Same sport, opposite programmes.
| Country | Programme shape |
|---|---|
| Australia | ~53% sprints — the sprint capital |
| France | ~51% routes of 1800m+ — stamina country |
| Japan | ~56% middle-distance (1350–1800m) |
Australia and France are near-perfect mirrors. More than half of Australian racing is sprints; more than half of French racing is a mile and an eighth or further. Japan concentrates in the middle. The why behind each shape — breeding tradition, the kind of racing a country chose to build — matters less than knowing the shape exists. A horse raised on Australian sprints has spent its career answering questions a French router is rarely asked, and the reverse.
That changes where you spend your time. In sprint country you read gate speed and early position first. In stayer country you weight stamina, class and trip fit, and you discount the lead. Port the wrong reading across the border and you will misprice the race before you have looked at a single horse. The spokes go deep on each: Australia, France, Japan and Hong Kong.
The Favourite Is More Reliable in Some Places Than Others
Favourites win about a third of all races everywhere — but "about a third" hides a real spread once you split it by market.
| Market | Favourite win rate |
|---|---|
| Australia | ~35% |
| Britain / Germany | ~34% |
| Hong Kong / Ascot | ~31% |
| UAE | ~27% |
| Strasbourg (deep fields) | ~22% |
The pattern tracks field size and competitiveness: the markets where favourites win least tend to be the ones with the biggest, most even fields. That is a measured pattern, not a proven mechanism — but it is enough to act on. A short price in Australia carries more weight than the identical price at a deep-field French track. "Fade the favourite" is a weak default in a sharp market and a more reasonable instinct in a soft one. The full country-by-country split is in how often do favourites win.
Pace and Style Reverse Across Borders
Most jurisdictions reward the horse that gets out and rolls. A few do not, and the gap between them is large enough to flip a read.
- On Irish turf, front-runners win about 12.9% and closers about 7.6% — a wide front-end bias, and the softer the ground the wider it gets.
- On Meydan dirt, the lead is worth even more: front-runners around 18.7%, closers around 7.9%. Lead or lose.
- On French all-weather, the bias disappears. Closers run roughly level with the pace — the one major surface we track where the held-up horse converts at the same clip as the leader.
So a pace read that is correct at Meydan can be exactly backwards in France. The lone front-runner is one of the better situations in the game in Ireland or the UAE, and a far weaker edge on French all-weather. Know which surface you are standing on before you count the front-runners. The mechanics are the same everywhere; the base rate is not. See Ireland and the UAE for the front-end markets, France for the exception, and pace handicapping for the method.
The Draw Is Local Too
Gate bias is not one number you can carry between tracks. At some courses it is structural — the run to the first bend is short enough that a wide gate is a genuine handicap, as at Pontefract or Happy Valley. At others it barely moves the result. The bias is a property of the specific course and distance, not of racing in general, so it has to be checked track by track rather than assumed. Draw bias by track lays out where it matters and where it doesn't.
The Takeaway: Know the Classroom
The handicapper's craft does not change at the border. What changes is everything you measure it against. Before you trust a form line, ask which country produced it:
- Read the programme. Sprint country rewards speed and position; stayer country rewards stamina and class. The card tells you what to study.
- Price the favourite to the market. A third overall, but ~35% in Australia down to ~22% in deep fields. The same price means different things.
- Check the surface before the pace. Front-end bias dominates on Irish soft and Meydan dirt, vanishes on French all-weather.
- Treat the draw as a track fact. Structural at some courses, irrelevant at others. Look it up; don't assume.
The why behind each country's shape is the secondary question. Knowing the shape is the first one, and it is the one that keeps you from misreading a horse before you have even rated it.
MWP reads the form the same way across every jurisdiction we cover: one normalised rating scale, gate stats, running styles and pace notes, so a Sha Tin figure and a Meydan figure mean the same thing. Open a real racecard and compare runners across borders, or learn the country-by-country method from the ground up in our free course, Do Your Homework.
Related: Australia · France · Japan · UAE / Meydan · Ireland · Hong Kong · How often do favourites win · Draw bias by track